
Network Operators and Alert Fatigue
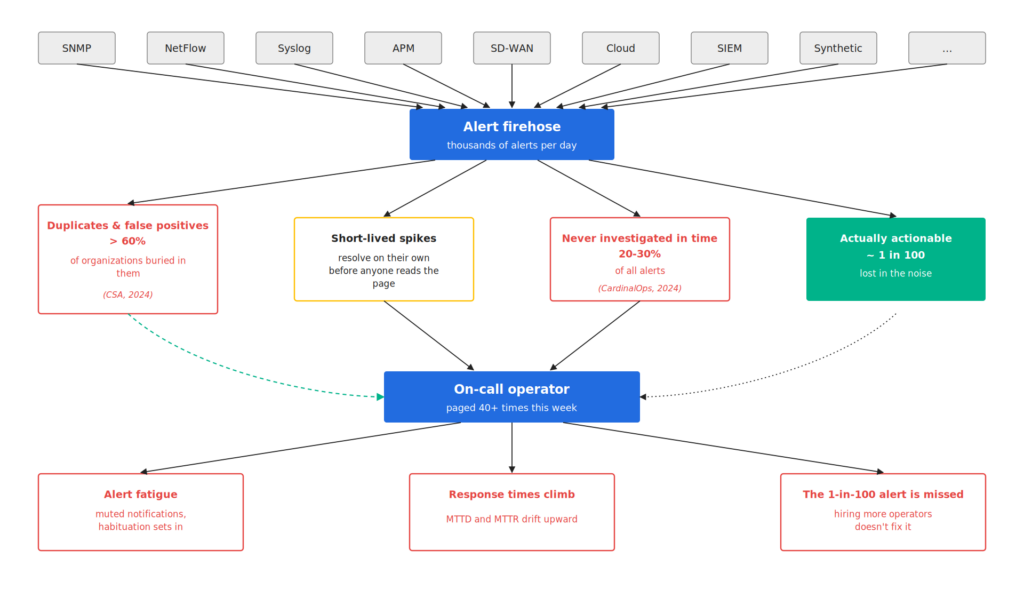
Manually triaging alerts in a large network is a losing fight. A modern ops team sees thousands of alerts a day from dozens of monitoring tools, and most of them are false positives, duplicates, or short-lived spikes that resolve on their own before anyone reads the page. More than 60% of organizations report being buried in duplicate and false-positive alerts, and 20–30% of alerts are never investigated in time. The result is alert fatigue. The on-call engineer who has been paged 40 times this week starts muting notifications, response times climb, and the one alert in a hundred that actually matters gets lost in the noise. More operators won’t close the gap. Alert volume grows with the network, not the size of the team, and operators tune out long before they reach the bottom of the queue.
AI-Powered Alert Triage
AI-driven triage breaks the linear relationship between alert volume and operator workload. Instead of asking a human to evaluate every alert from scratch, an AI agent picks up each alert as it fires, gathers context across the systems involved, runs the diagnostic checks an experienced operator would have run, and returns a root-cause summary with recommended next steps. False positives get filtered out before they ever reach a human. The alerts that do escalate arrive pre-enriched, with the supporting evidence, the affected components, and a working hypothesis already attached. Vendors across the SOC and ITOps space report 60–90% reductions in mean time to detect and similar cuts in time to resolve, mostly because the agent does away with the serial tool-hopping that eats up most of an investigation. The operator stops being a triage clerk and gets to spend time on the cases that actually need judgment.
Trustgrid Watch
Trustgrid Watch brings that model to network operations. Watch is an event-driven AI that activates the moment a Trustgrid alert fires, whether it’s a deployment-health issue like DNS or control-plane connectivity, a dataplane disruption or excessive traffic latency on the internet path. It runs a Trustgrid-maintained runbook against the affected site while the issue is still happening, summarizes the root cause, enriches the alert with the steps it took and the evidence it gathered, and recommends concrete next actions. Results land in the same Trustgrid alert center and customer alert channels operators already use, and an AI assistant is available for any follow-up questions. Watch is also exposed through the Trustgrid MCP server, so customer agent harnesses can perform alert triage as a tool inside their own incident workflows.
Watch diagnostic logic lives in Trustgrid runbooks, not in product code. Trustgrid’s operations team writes and refines these runbooks in plain language, capturing the same investigative steps a senior engineer would walk through, and uses LLM-driven runbook linting to keep the wording tight, consistent, and free of contradictory instructions. Because runbooks are content rather than code, they can evolve at the speed of operations. A new failure mode discovered on Monday can show up in the triage workflow by Tuesday, with no engineering release cycle. The same runbooks can be reused by other internal agents and by customer agents through MCP, so the institutional knowledge of Trustgrid operations becomes a shared asset instead of something locked in one person’s head.
Watch also has the advantage of acting in the moment. Watch doesn’t reason from stale dashboards or post-incident logs. It reaches into the affected node and the surrounding network while the issue is still live, before temporal drift erases the evidence. It can pull current dataplane and controlplane status, gather resource statistics and run latency tests inside and outside the dataplane tunnel. A detailed description of what tests were run, and the logic of why they were run, is then attached to the alert so the operator can fully understand the diagnosis steps performed.
Example: A Gateway Latency Alert
A gateway latency alert fires when traffic crossing a Trustgrid gateway sits above its configured latency threshold for long enough to matter. On its own, the alert doesn’t tell the operator much. The cause could be a noisy ISP path, a saturated tunnel, an overloaded gateway, or a problem confined to a single site, and the operator usually has to start from zero to find out which. When Watch picks up the alert, it loads the relevant runbook and works through a sequence of diagnostic checks:
- Determine the scope of the problem by checking whether the latency is specific to one gateway or affects every gateway in the cluster.
- Run latency tests on both sides of the dataplane tunnel to separate internet-path issues from gateway-side issues.
- Pull CPU, memory, and tunnel-bandwidth statistics from the gateway to see whether the box itself is under resource pressure.
The result is an enriched alert that already contains the scope, the likely root cause, and the evidence Watch used to get there, so the operator can move straight to a fix instead of opening a fresh investigation.
Alert Triage That Scales With Your Network
Manual alert triage doesn’t scale. At the volumes a modern distributed network produces, it doesn’t even degrade gracefully. It collapses into alert fatigue, missed incidents, and worn-out on-call rotations. AI-driven triage scales because it does the routine investigation work in parallel and in real time, leaving humans to handle the calls that genuinely require judgment. Trustgrid Watch brings that capability to network operations with the two ingredients that matter in production: runbooks written by Trustgrid’s own operators, and live diagnostic tools that examine the remote site at the exact moment the alert fires. The result is alerts that arrive already triaged, root causes identified in seconds instead of hours, and ops teams that spend their time fixing problems instead of chasing them.

Chief Technology Officer
Steven Stites is the CTO and Co-Founder of Trustgrid, where he leads the vision and engineering teams behind the company’s innovative platform for secure networking and edge computing solutions. With over 20 years of expertise in network security, distributed computing, and cloud infrastructure, Steven brings deep industry experience to establishing Trustgrid as a trusted provider for secure, scalable application connectivity across FinTech, HealthTech, SaaS, and enterprise environments.
Leadership at Trustgrid
As CTO and Co-Founder, Steven drives the technical strategy, product development, and architectural direction at Trustgrid. He focuses on creating solutions that bridge modern hybrid ecosystems, empowering SaaS and cloud application providers to connect securely to on-premise resources with maximum reliability and performance. Steven’s guidance is central to Trustgrid’s integration of SD-WAN, Zero Trust Network Access (ZTNA), and edge computing into a unified platform, simplifying deployment, elevating data security, and supporting enterprise-grade operational scale .
Professional background
Before founding Trustgrid in 2017, Steven held senior technical leadership roles at Cisco, where he served as Senior Technical Leader for IoT Cloud and Cloud Web Security. At Cisco, he architected and led customer engagement for major SaaS security products, designing enterprise-scale networking and security solutions and overseeing technical vetting for large-scale technology acquisitions. Earlier in his career, Steven spent over a decade at IBM as a technical lead, driving development for network monitoring and distributed application performance products, and began as a software engineer researching sonar and signal processing at Applied Research Labs. He holds a bachelor’s degree in Electrical and Electronics Engineering from The University of Texas at Austin .
Building the Future of Connectivity
Steven’s vision at Trustgrid centers on advancing secure, cloud-like connectivity across modern digital environments, ensuring frictionless integration between public cloud, data center, and on-premise resources. His background in high-performance network design and distributed security shapes Trustgrid’s commitment to eliminating complexity in deploying, monitoring, and supporting thousands of application connections. He is also an inventor, with patents for secure network technologies and is recognized as a strategic leader with a rare blend of deep technical expertise and business insight .
About Steven Stites
Steven is a passionate technology executive and product architect based in Austin, Texas. His approach emphasizes pragmatic problem-solving, strong team leadership, and client advocacy, helping organizations leverage networking and security innovations to enable secure, scalable applications. He is highly regarded for his ability to clarify complex technical challenges, mentor teams, and deliver solutions that balance technical excellence with cost efficiency. Steven is deeply interested in machine learning, cloud security, and agile product development.
Connect with Steven
https://www.linkedin.com/in/srstites/
Or
Contact him at www.trustgrid.io